IIF works actively on energy conservation measures that relate to asset management, with the aim of creating a sustainable society through the reduction of environmental impact. As part of our carbon risk measures, at IIF we collectively manage our energy consumption and GHG emissions by outsourcing this work to external contractors; this has enabled us to gather highly accurate and transparent data. We then analyze this data as part of our continuing efforts at managing reductions in energy consumption.
This table can be scrolled up, down, left and right
| Unit | 2050 (Target) |
2050 (Target) |
FY2024 | FY2023 | FY2022 | FY2021 (Base year) |
FY2020 | FY2019 | FY2018 | FY2017 | 2016 | 2015 | ||
|---|---|---|---|---|---|---|---|---|---|---|---|---|---|---|
| February 2024- January 2025 | February 2023- January 2024 | February 2022- January 2023 | February 2021- January 2022 | February 2020- January 2021 | February 2019- January 2020 | February 2018- January 2019 | February 2017- January 2018 | |||||||
| GHG emissions | ||||||||||||||
| Scope 1 (direct emissions) | t-CO2 | Net-zero | ★ 25,514 | 24,149 | 25,733 | 25,758 | 9,133 | 0 | 0 | 429 | 588 | 218 | ||
| Scope 2 (indirect emissions) | t-CO2 | ★ 208 | 97 | 29 | 16,282 | 11,412 | 2,564 | 2,694 | 6,599 | 8,337 | 7,588 | |||
| Scope 1+2 | t-CO2 | SBT Certified Reduce by 42%*1 |
25,721 | 24,246 | 25,762 | 42,040 | 20,545 | 2,564 | 2,694 | 7,028 | 8,925 | 7,806 | ||
| Scope 3 | t-CO2 | 166,658 | 144,681 | 144,425 | 127,009 | 117,711 | - | - | - | - | - | |||
| Category 1 (Purchased goods and services) | t-CO2 | 7,809 | 7,085 | 7,349 | 6,707 | - | - | - | - | - | - | |||
| Category 2 (Capital goods) | t-CO2 | 16,484 | 23,113 | 17,307 | 13,327 | - | - | - | - | - | - | |||
| Category 3 (Fuel- and energy-related activities not included in Scope 1 or 2) | t-CO2 | 48,537 | 46,124 | 46,241 | 27,392 | - | - | - | - | - | - | |||
| Category 5 (Waste generated in operations) | t-CO2 | 13,354 | 557 | 681 | 724 | - | - | - | - | - | - | |||
| Category 6 (Business travel) | t-CO2 | 1 | 1 | 1 | 1 | - | - | - | - | - | - | |||
| Category 7 (Employee commuting) | t-CO2 | 1 | 1 | 1 | 1 | - | - | - | - | - | - | |||
| Category 12 (End of life treatment of sold products) | t-CO2 | 322 | 156 | 137 | 0 | - | - | - | - | - | - | |||
| Category 13 (Downstream leased assets) | t-CO2 | ★ 78,042 | 67,644 | 72,655 | 78,802 | - | - | - | - | - | - | |||
| Category 15 (Investments) | t-CO2 | 2,109 | 0 | 54 | 56 | - | - | - | - | - | - | |||
| Per unit | t-CO2/m2 | 0.09 | 0.11 | 0.11 | 0.11 | 0.11 | 0.07 | 0.08 | 0.08 | 0.09 | 0.11 | |||
| Date collection rate | % | 100.0 | 100.0 | 100.0 | 100.0 | 100.0 | 100.0 | 100.0 | 100.0 | 100.0 | 100.0 | |||
| Energy consumption | MWh | 166,444 | 149,619 | 152,185 | 236,215 | 190,541 | 151,381 | 146,045 | 139,627 | 125,801 | 138,913 | |||
| Energy consumption per unit | kWh/m2 | 87.62 | 97.79 | 102.70 | 156.70 | 147.94 | 134.05 | 157.79 | 159.02 | 177.46 | 194.35 | |||
| Date collection rate | % | 100.0 | 100.0 | 100.0 | 100.0 | 100.0 | 100.0 | 100.0 | 100.0 | 100.0 | 100.0 | |||
| Fuel / gas consumption | MWh | 154,691 | 147,679 | 161,875 | 163,548 | 65,296 | 11,241 | 12,977 | 12,997 | 12,435 | 7,633 | |||
| Fuel / gas consumption per unit | kWh/m2 | 81.43 | 96.52 | 109.20 | 108.50 | 50.70 | 9.95 | 14.02 | 14.80 | 17.54 | 10.68 | |||
| Date collection rate | % | 100.0 | 100.0 | 100.0 | 100.0 | 100.0 | 100.0 | 100.0 | 100.0 | 100.0 | 100.0 | |||
| Energy/fuel/gas consumption (Scope1+2) | MWh | ★ 209,401 | - | - | - | - | - | - | - | - | - | |||
| Water Use | thousand m3 | 1,080 | 1,038 | 927 | 916 | 656 | 532 | 549 | 543 | 362 | 363 | |||
| Water use per unit | m3/m2 | 0.57 | 0.68 | 0.63 | 0.61 | 0.51 | 0.47 | 0.59 | 0.61 | 0.51 | 0.51 | |||
| Date collection rate | % | 100.0 | 100.0 | 100.0 | 100.0 | 100.0 | 100.0 | 100.0 | 100.0 | 100.0 | 100.0 | |||
| Water Use (assurance figure) | thousand m3 | ★ 983 | - | - | - | - | - | - | - | - | - | |||
| Volume of non-hazardous waste | t | 9,064 | 6,324 | 7,090 | 7,676 | 6,176 | 5,422 | 6,403 | 5,827 | 3,505 | 2,376 | |||
| Volume of hazardous waste | t | 450 | 360 | 329 | 293 | 163 | 33 | 104 | 105 | 94 | 210 | |||
| Recycling rate | % | 46.9 | 29.5 | 40.5 | 40.4 | 45.1 | 45.2 | 32.1 | 31.6 | 33.2 | - | |||
| Date collection rate | % | 88.7 | 88.4 | 89.9 | 90.1 | 89.6 | 93.4 | 100.0 | 100.0 | 100.0 | 94.5 |

At IIF, we implement certain sustainability and energy-saving measures and make efforts toward more efficient energy use at our properties to show greater consideration for the environment and lessen its environmental impact. We collectively manage GHG emission, electrical power, fuel, and water consumption and analyze the accumulated data, which is both accurate and highly transparent to actively manage reduction of energy use.
In support of initiatives by the Tokyo Metropolitan Government’s Bureau of Environment to make zero CO2 emissions in Tokyo, IIF has donated 1,341tons of CO2 credits acquired through energy conservation efforts in accordance with Tokyo’s Cap -and- Trade Program
For details, please refer to the website of Tokyo Metropolitan Government Bureau of Environment
www.kankyo.metro.tokyo.jp/en/climate/index.html
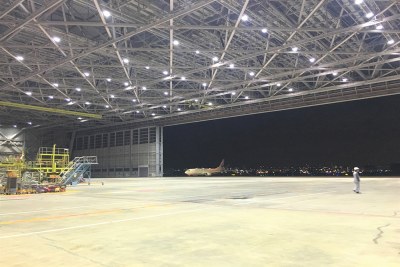
Cooperating with tenants, IIF actively implements energy-saving measures, such as sourcing of renewable energy, installing light-emitting diode (LED) lighting and solar power.

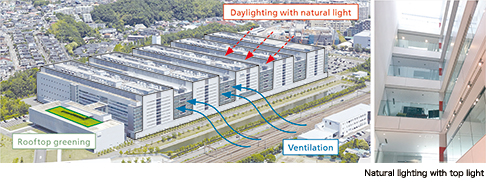
IIF Shonan Health Innovation Park has a green building design and is the first research facility to be selected by the Ministry of Land, Infrastructure, Transport and Tourism’s Model Project for Promoting CO2 Reduction in Housing and Building. Passive design that makes maximum use of natural energy has been adopted in addition to active technology for using energy efficiently. Also, electricity consumption is reduced through usage of daylight and installation of motion sensors, and use is made of exhaust heat from experiments. In addition, as a new initiative, the facility switched to electricity derived from renewable resources in electricity procurement in line with RE100 standards from August 1, 2021, thus contributing to IIF’s newly established CO2 emissions reduction targets toward carbon neutrality by 2050.
Replacing existing lighting with LED lighting saves energy and extends the lives of lamps.
In the process of conversion to LED lighting, the expected reduction in electrical capacity is discussed beforehand with the tenant and in some cases contracts are concluded in which a portion of the savings generated from the reduction of electricity use can be paid as rent.
Properties:
Solar panels are installed on the roofs of facility buildings to reduce GHG emissions.
It aims to contribute to the realization of a sustainable society by enabling both reduced environmental impact and economic growth through the efficient use of resources and minimization of waste. IIF works towards the sustainable use of resources by actively working to make effective use of water resources and promoting waste minimization.

While water use per unit increased slightly from 0.51 in 2015 to 0.68 in FY2023, there was no significant increase in any individual property.
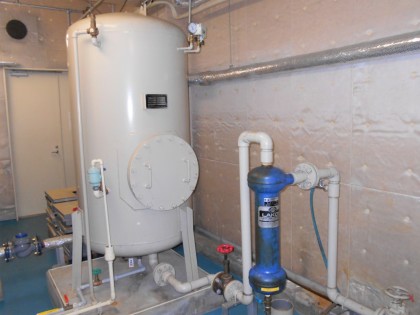
IIF Mitaka Card Center seeks to use water resources effectively by tapping reclaimed water, which is hauled from a well through automated pumping machine, for the premises' sprinkler systems. Intermediate water is also used as daily water in the event of an emergency or disaster.
We seek to waste properly by means such as appropriately separating the waste produced by the properties to improve the recycling rate and advancing initiatives to minimize the amount of waste by monitoring the amount of waste generated.
IIF is working to maintain the safety of its buildings by conducting building and earthquake risk assessments at the time of acquisition as well as collecting engineering reports on a regular basis.
When acquiring real estate properties, KJRM takes various environmental factors into consideration before making investment decisions: property inspections, land history investigations, and other related research on environmental risk factors.
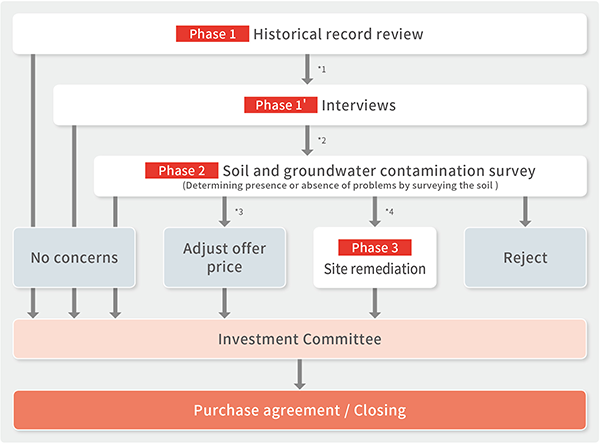
During soil and environmental investigations, third party experts perform environmental pollution investigations. In principle, Investment Corporations will invest only in properties that are appropriately treated in accordance with the Soil Contamination Countermeasures Act and other environmental laws and regulations. Prior to executing any purchase agreement, Investment Corporations will have experts conduct a soil and environmental contamination survey to assist in assessing a property’s environmental risks. Based on the Risk Management Manual regarding soil contamination and other matters separately established by KJRM, investigations and countermeasures are conducted in accordance with the pre-investment assessment workflow chart indicated below (“Soil Contamination Investigation and Countermeasure Flow”).
Concerning soil contamination, its property acquisition manual stipulates that investment targets shall be, in principle, properties “that are very unlikely to have soil contamination or that cannot eliminate the possibility of having soil contamination but are very unlikely to carry environmental damage risk.”
IIF is working to maintain the safety of its buildings by conducting building and earthquake risk assessments at the time of acquisition as well as collecting engineering reports on a regular basis. In addition, secondary assessments are performed as well. When results of those assessments conclude that earthquake-resistant reinforcement construction is required, we aim to make choices that will provide the necessary seismic retrofitting while minimizing waste. At the same time, we also work to reduce GHG emissions and energy consumption in the updated facility.

Asbestos is a naturally occurring mineral fiber sometimes called sekimen or ishiwata, and breathing it is highly likely to be hazardous to health, thus implementation of some measures is required. IIF measures the air environment once a year to confirm the dispersal status of asbestos.